Admin Dashboard
Estimated Reading Time: 1 MinutesWhen you login into the admin control panel, you are welcomed with Dashboard screen which presents and organizes your daily usage information in a way that is easy to read. It gives an overview of your knowledge base contents in the form of charts and graphs. You can also reach to index page either by clicking the Dashboard link available in left navigation or through Admin Dashboard link (visible to admin users only) available in the header section the of front end.
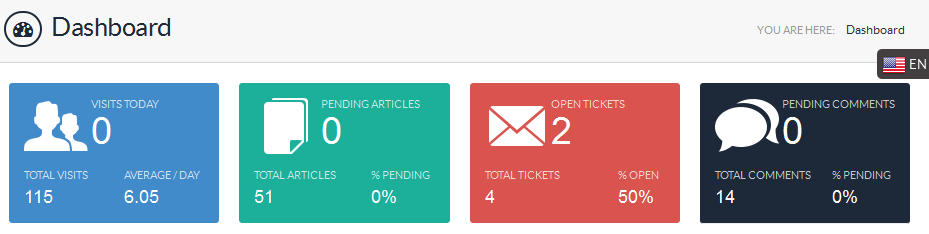
Dashboard Screen displays information about Visits, Pending Articles, Open Tickets and Pending Comments in the form of rectangular boxes. You can click on these boxes to view details of respective features. In multi-language edition, dashboard displays these features for the language selected in language drop-down available on right side of the page. However, you can change the language of your choice from the drop-down to view the details in the language selected.
Graphical representation of visits is displayed on dashboard page which represents total article views of last 15 days. You can click on View Details arrow to see the detailed view of the report. Refer article Traffic Statistics for more details.
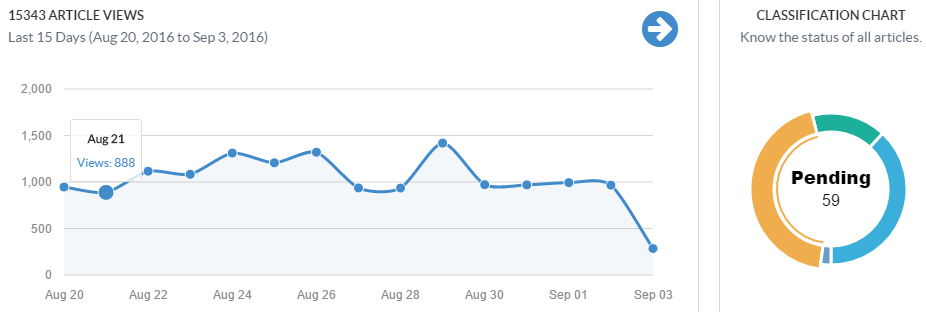
Donut chart represents the number of articles of different statuses, such as pending, approved, featured and saved as drafts. A portion of donut represents a total number of articles of a particular status. You can move the mouse pointer on each portion to view the number of articles.
- Applicable To: Standard Edition, Standard (Multi-Language) Edition, Enterprise Edition (MySQL), Enterprise Multi-Language Edition (MySQL), Enterprise Edition (SQL Server), Enterprise Multi-Language Edition (SQL Server)