Knowledge Base Traffic Statistics
Estimated Reading Time: 1 MinutesExpand "Statistics" section in left navigation bar and click on "Traffic" link to view reports related to the visitors’ traffic in the knowledge base. The report displays the line chart and tabular representation of article views as shown below:
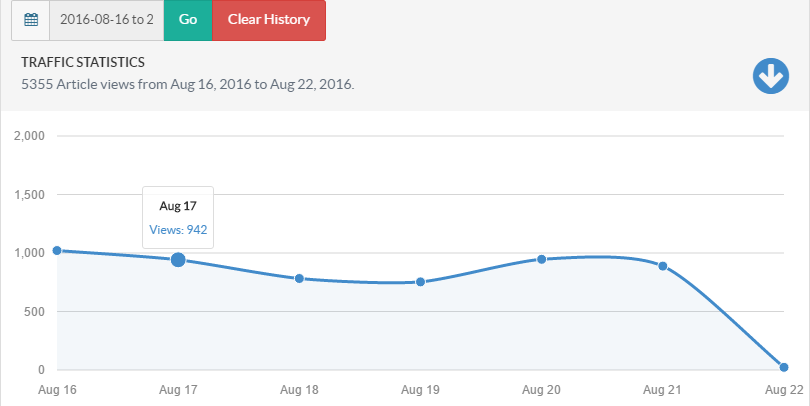
- X-axis of the graph shows the dates for the article hits.
- Y-axis of the graph shows the number of articles viewed by users with respect to the date in X-axis.
- You can set range of the date in date tab to view statistics corresponding to that range. To achieve this, select the date range from the date drop-down and click on Go button.
- You can also click on "Clear History" button to remove the traffic statistics of specified time.
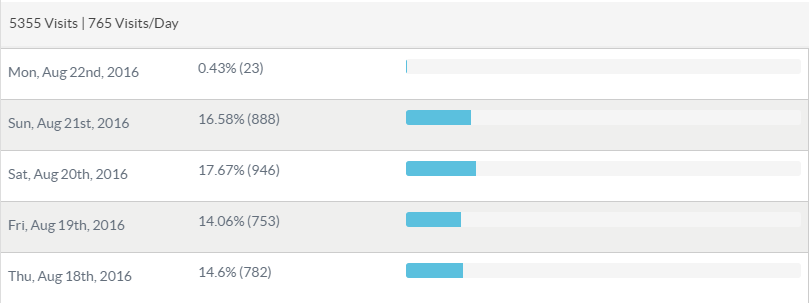
- A tabular representation of articles is shown in the figure above. The total number of articles views in specified date range along with the average views per day (5355 Visits | 765 Visits/Day) is displayed in a header row.
- The first column of the table displays the date on which articles have been viewed. The date is displayed according to the range you have specified.
- The second column of the table displays percentage share of a number of article views of that date with respect to the total number of articles views for the whole specified time period. Number of article views is enclosed in brackets.
- The third column is the graphical representation of the second column.
- Applicable To: Standard Edition, Standard (Multi-Language) Edition, Enterprise Edition (MySQL), Enterprise Multi-Language Edition (MySQL), Enterprise Edition (SQL Server), Enterprise Multi-Language Edition (SQL Server)